Chart Swapping in Tableau
Rajtilak Bhattacharjee
-
October 21, 2019
Looking at the same data in a different way can lead to new insights. So it's always best to let your users the ability to choose various chart types while they are viewing a Tableau dashboard. And the process using which we can do this is very simple, so you do not need to spend much time over this. Here's how you can do it.
1. Create the charts in individual Tableau worksheets
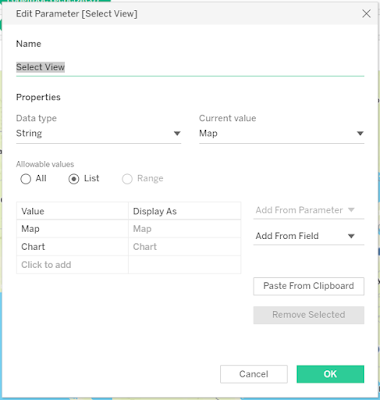
2. Create a Parameter like this
Please note that this might look a bit different since I took this screenshot on my online Tableau Editor. Although it's in Beta, you can use it too.
3. Create a Calculated Field using the Parameter we created
Please note that you might not see the Dependencies at first.
4. Add the Parameter in one of the worksheet, and select that worksheet in the Parameter
5. Drag and drop the Calculated Field in the Filters card, select the name of the respective field in the filter
6. Repeat the same for all other worksheets
7. Create a Tableau dashboard
8. Add the Parameter to the dashboard
9. Add a vertical layout container on the dashboard
10. Add the first sheet in the container, ensure that the name of that sheet is showing in the Parameter
11. Select the name of the other sheet in the Parameter, and drop that sheet on the container
12. Don't forget to hide the title of the sheets
You can download/view a sample from here.
[Pic courtesy: Gauthier]
Breaking News
Connect on Facebook
Categories
Add-in
Adsense
Alteryx
Android
Apple
Apps
Artificial Intelligence
Blogger
Blogging
Browser
Business Intelligence
Chrome
Coding
Computer Vision
Data Analytics
Data Science
Data Visualization
Deep Learning
Downloads
EDA
Excel
Extension
Firefox
Gaming
Gartner
GitHub
Gmail
Google
Google Domains
Google Sheet
GPT3
Guest Post
How To
Humor
IEEE
Instagram
Interview
iOS
iPhone
Job
Jupyter
Kotlin
Language
Machine Learning
Macro
Mathematics
Medium
Microsoft
Mobile
NLP
Office
Opera
Paid Post
Pandas
Pixel
PowerPoint
Programming
PUBG
Python
R
Reddit
Safari
SAP
Security
Service
Social Media
Tableau
Templates
Tool
Training
VBA
VGG16
Video
Visualization
WhatsApp
Windows
Windows Phone
Word
WordPress


